One in three state contracts is awarded without competition — the indicator the Plan calls for already exists
Clause 8.1.4 of the National Action Plan approved by the Presidential Decree of 11 September 2026 calls for measurable competition indicators. AZTender computed one across 98,261 contracts: 35.9 % were awarded without competing offers.
On 11 September 2026, a Decree of the President of the Republic of Azerbaijan approved the National Action Plan for the Development of Competition and the Prevention of Monopolistic Activity for 2027–2029. Clause 8.1.4 mandates the creation of a system of measurable indicators and a competition map. We calculated one such indicator across 98,261 contracts — it is built entirely from data the state already publishes. On 11 September 2026, President of the Republic of Azerbaijan Ilham Aliyev signed a Decree approving the National Action Plan for the Development of Competition and the Prevention of Monopolistic Activity for 2027–2029.
The document contains a phrase that looks technical in a text on competition policy but in fact sets the agenda for the next three years: promoting competition in public procurement is named one of the principal global directions of modern competition policy — alongside the regulation of digital markets, artificial-intelligence and data-driven analysis, and the transition to a green economy.
The section assessing the current situation places this in a national frame. Among the stated priorities: regular assessment of competition levels in product markets, broadening participation in public procurement, and strengthening the capacity for scientific and data-driven analysis.
The Action Plan then converts intent into a head-of-state instruction, with an implementing body, co-implementers and a deadline. Clause 8.1.4: develop a system of indicators capable of assessing the level of competition across the country and its regions, and on that basis produce a competition map. Lead implementer — the State Service for Antimonopoly Control and Consumer Market Supervision under the President of the Republic of Azerbaijan; co-implementers — the State Statistical Committee, the Ministry of Economy, and the Ministry of Digital Development and Transport. Deadline: 2027–2029. Clause 8.2.2 adds the creation of a modern methodological base for diagnosing the competitive environment, with a 2027–2028 deadline.
The task has been set at the highest level, and it has a deadline. The question is what such indicators should be built from.
One indicator already exists in the data
As it turns out, in the state's own open data. The 2023 Law on Public Procurement established the legal basis for digitalising procurement processes — and one incidental but consequential result is that every concluded contract in the registry carries a recorded procurement method.
That is a ready-made competition indicator: the share of contracts awarded without comparing offers. It is precisely the metric the European Commission tracks in its Single Market Scoreboard, and which the World Bank and the EBRD include in assessments of procurement-system maturity.
We analysed 98,261 contracts and calculated the distribution.
| Procurement method | Contracts | Share | Value, AZN m | Average contract, AZN |
|---|---|---|---|---|
| Bir mənbə — single source | 25,748 | 26.2 % | 12,079 | 469,128 |
| Kotirovka — quotation | 24,393 | 24.8 % | 7,110 | 291,486 |
| Açıq Tender — open tender | 20,703 | 21.1 % | 26,783 | 1,293,693 |
| method not recorded | 16,112 | 16.4 % | 7,387 | 458,442 |
| Birbaşa — direct award | 9,536 | 9.7 % | 142 | 14,873 |
| Təkliflər sorğusu — request for proposals | 1,231 | 1.3 % | 2,946 | 2,393,513 |
| Open tender above USD 3.0m equivalent | 525 | 0.5 % | 5,429 | 10,340,906 |
| Two-stage tender | 7 | — | 0.4 | 52,730 |
| Restricted tender | 6 | — | 0.2 | 27,607 |
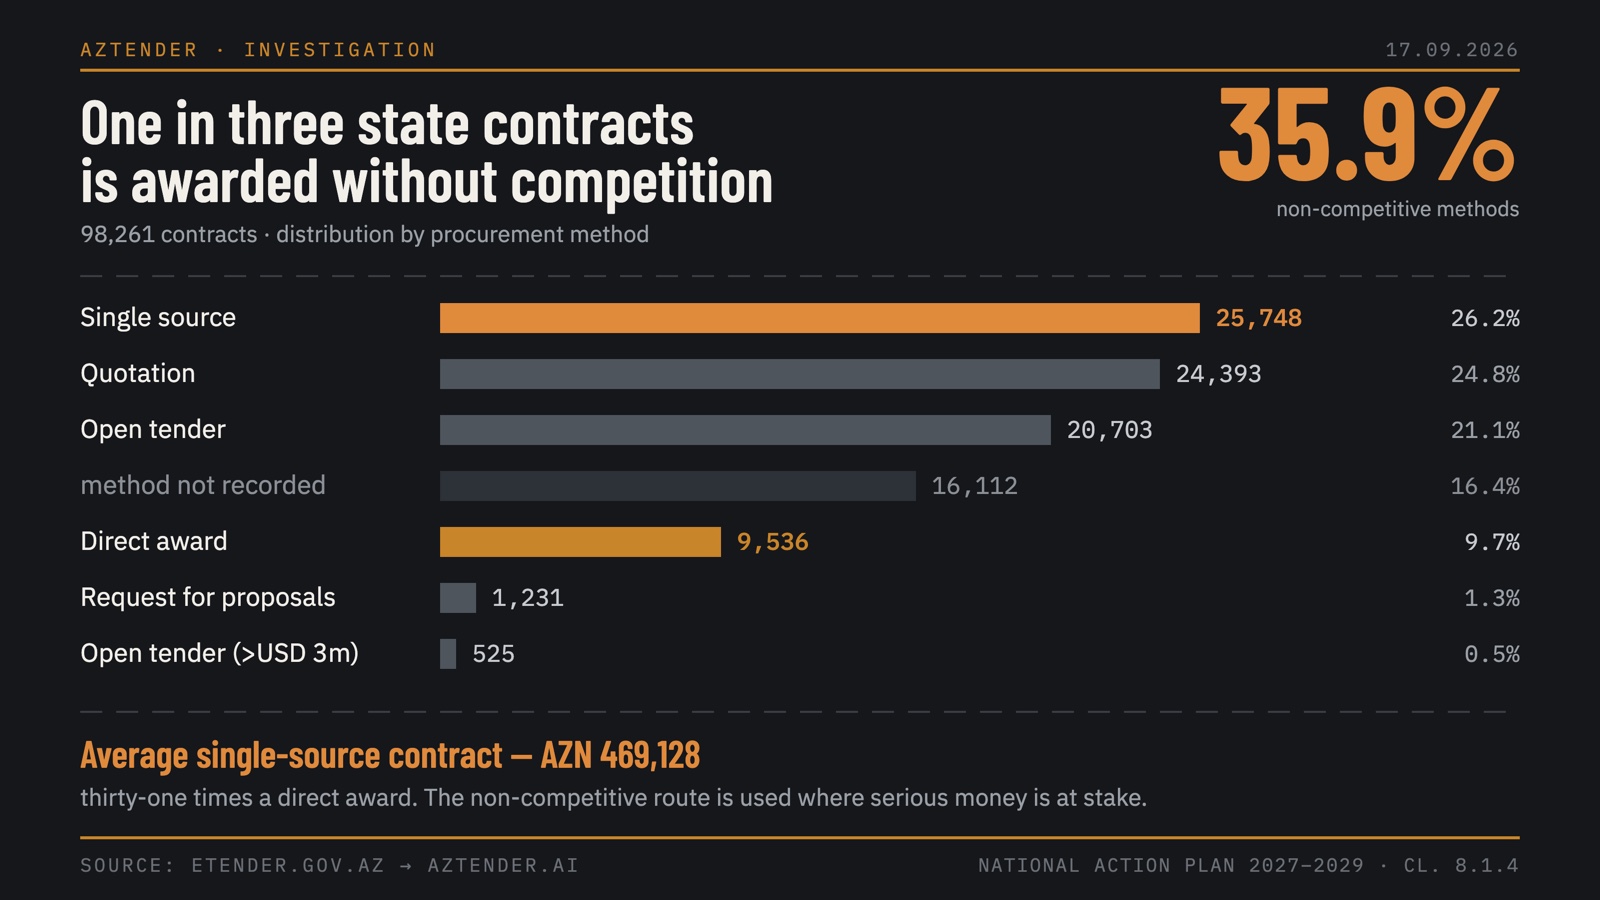
The first thing that stands out: the most common procurement method in the country is not a tender. Single-source procurement accounts for 26.2 % of contracts; open tenders, 21.1 %.
Combine the two non-competitive methods: 35,284 contracts, 35.9 % of the total, worth AZN 12.2 billion. One in three state contracts is concluded without any comparison of offers.
The detail that changes the reading
Non-competitive procurement is usually dismissed as small change: something was needed urgently, the sum was modest, running a tender would have cost more than the purchase itself. The data contradicts this.
Direct awards, «Birbaşa», genuinely are small: an average contract of AZN 14,873, and 9,536 contracts amounting to just AZN 142 million — 0.2 % of all money.
«Bir mənbə» operates on an entirely different scale. The average contract is AZN 469,128 — thirty-one times larger than a direct award. By value, single-source procurement ranks second in the country after open tenders, at AZN 12.1 billion.
In other words, the non-competitive route is used not where a tender would be uneconomical, but where serious money is at stake.
What these figures do not mean
Single-source procurement is lawful. Legislation explicitly provides for the circumstances in which it is permitted: no alternative supplier, continuation of previously commenced work, urgency, security considerations. A 26 % share is not in itself a violation and is not evidence of abuse.
It is a measurable indicator — precisely the kind Clause 8.1.4 calls for. The logic of the metric is simple: the more money that bypasses competition, the less the state can know about the real price of what it buys.
One further caveat is mandatory when working with the registry: in 16.4 % of contracts the procurement method is not recorded at all. That is AZN 7.4 billion which can be assigned to neither the competitive nor the non-competitive group. This is itself a diagnostic finding — and the first candidate for correction when the methodology under Clause 8.2.2 is developed.
The map Clause 8.1.4 calls for
The Plan approved by the President speaks not merely of indicators but of a competition map covering the country and its regions. For such a map, a national average is useless: the state does not procure as a single bloc. Behind the figure of 35.9 % stand 5,308 individual contracting authorities.
We selected those whose procurement activity is substantial enough to support a judgement: 697 organisations that concluded at least thirty contracts since 2020. Among them, the average share of non-competitive procurement is 40.4 % — higher than the national figure. Then the spread begins:
- 209 contracting authorities — nearly one in three — award more than half of their contracts without competition;
- 81 award more than eighty per cent;
- and only 20 make no use of non-competitive methods at all.
Eighty organisations at one pole and twenty at the other is not statistical noise, nor is it sectoral specificity. These are different behavioural models operating within one legal system, under identical rules and identical thresholds.
This is a map in the literal sense: the indicator is calculated separately for each contracting authority, is comparable across organisations, and is reproducible for any given date.
How it is calculated
The method is deliberately simple.
The unit of observation is the concluded contract, not the procurement notice. Four fields are taken from each record: procurement method, value, contracting authority, and supplier with its taxpayer number. Methods are grouped into competitive and non-competitive, and the share is calculated — both by contract count and by value, because the two pictures diverge.
Data is drawn from the AZTender corpus as of 17 September 2026. The source is the state electronic procurement system. The corpus contains corrupted contract dates falling outside any plausible range; these do not affect the distribution by procurement method, but must be filtered out when constructing year-on-year trends.
Nothing beyond open data and arithmetic was required for this calculation. That may be the central finding: the system of indicators mandated by the Presidential Decree of 11 September 2026 can, in the public-procurement domain, rest on data the state already collects today. The work does not start from zero.
The full text of the Plan is published on the official website of the President of the Republic of Azerbaijan: president.az.
What comes next
From the next instalment we move from the country to specific institutions. For each: the share of non-competitive procurement, average contract value, supplier concentration, and year-on-year trends. The methodology is the one set out above; the data is open.
It is from such slices that the competition map — due to be built by 2029 under the Presidential Decree — is assembled.
Calculations were performed on the AZTender corpus — a public-procurement analysis platform consolidating the registries of Azerbaijan, Ukraine, Slovakia and European Union member states. To verify the figures or build your own view: aztender.ai.
A signal, not a verdict.